Segment Information
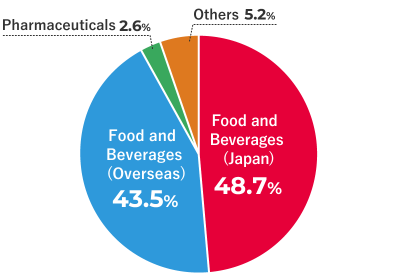
FY2022 Net sales by region
(Segment breakdown)
| Net sales (millions of yen) |
Ratio(%) | ||
|---|---|---|---|
| Food and Beverages (Japan) |
240,455 | 48.7 | |
| Food and Beverages (Overseas) |
215,109 | 43.5 | |
| The Americas | 64,920 | 13.1 | |
| Asia and Oceania | 140,465 | 28.4 | |
| Europe | 9,724 | 2.0 | |
| Pharmaceuticals | 12,763 | 2.6 | |
| Others | 25,445 | 5.2 | |
| Food and Beverages (Japan) |
|
|---|---|
| 240,455 | |
| 48.7 | |
| Food and Beverages (Overseas) |
|
| 215,109 | |
| 43.5 | |
| The Americas | |
| 64,920 | |
| 13.1 | |
| Asia and Oceania | |
| 140,465 | |
| 28.4 | |
| Europe | |
| 9,724 | |
| 2.0 | |
| Pharmaceuticals | |
| 12,763 | |
| 2.6 | |
| Others | |
| 25,474453 | |
| 5.2 | |
Note:Net sales are shown before elimination of intersegment sales.
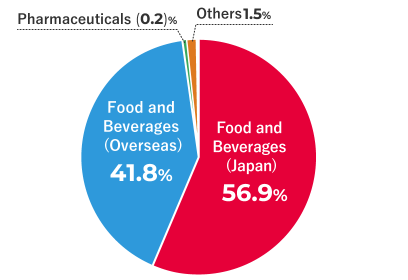
FY2022 Operating profit by region
(Segment breakdown)
| Net sales (millions of yen) |
Ratio(%) | ||
|---|---|---|---|
| Food and Beverages (Japan) |
47,443 | 56.9 | |
| Food and Beverages (Overseas) |
34,802 | 41.8 | |
| The Americas | 15,974 | 19.2 | |
| Asia and Oceania | 18,711 | 22.5 | |
| Europe | 116 | 0.1 | |
| Pharmaceuticals | (192) | (0.2) | |
| Others | 1,242 | 1.5 | |
| Food and Beverages (Japan) |
|
|---|---|
| 47,443 | |
| 56.9 | |
| Food and Beverages (Overseas) |
|
| 34,802 | |
| 41.8 | |
| The Americas | |
| 15,974 | |
| 19.2 | |
| Asia and Oceania | |
| 18,711 | |
| 22.5 | |
| Europe | |
| 116 | |
| 0.1 | |
| Pharmaceuticals | |
| (192) | |
| (0.2) | |
| Others | |
| 1,242 | |
| 1.5 | |
Note:Operating profit is shown before adjustments, such as Company-wide expenses.
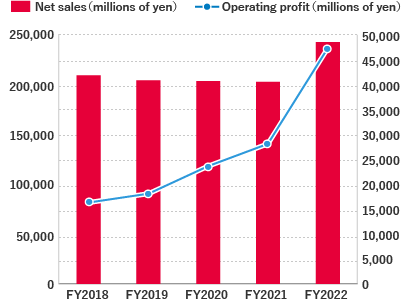
Food and Beverages (Japan)
| FY2018 | FY2019 | FY2020 | FY2021 | FY2022 | |
|---|---|---|---|---|---|
| Net sales | 214,957 | 209,380 | 207,051 | 203,293 | 240,455 |
| Operating profit |
16,431 | 18,209 | 23,767 | 28,243 | 47,443 |
Notes: 1. Net sales are shown before elimination of intersegment sales.
2. Operating profit is shown before adjustments, such as Company-wide expenses.
3. “Accounting Standard for Revenue Recognition” is applied from fiscal year ended March 31, 2022.
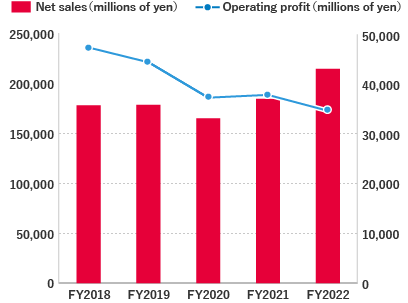
Food and Beverages (Overseas)
| FY2018 | FY2019 | FY2020 | FY2021 | FY2022 | |
|---|---|---|---|---|---|
| Net sales | 178,365 | 179,005 | 165,408 | 185,000 | 215,109 |
| Operating profit |
47,511 | 44,546 | 37,422 | 37,986 | 34,802 |
Notes: 1. Net sales are shown before elimination of intersegment sales.
2. Operating profit is shown before adjustments, such as Company-wide expenses.
Pharmaceuticals
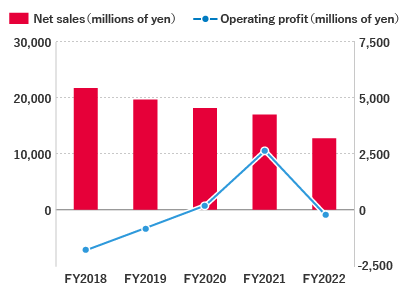
| FY2018 | FY2019 | FY2020 | FY2021 | FY2022 | |
|---|---|---|---|---|---|
| Net sales | 21,696 | 19,670 | 18,123 | 16,992 | 12,763 |
| Operating profit |
(1,803) | (811) | 191 | 2,634 | (192) |
Notes: 1. Net sales are shown before elimination of intersegment sales.
2. Operating profit is shown before adjustments, such as Company-wide expenses.
3. “Accounting Standard for Revenue Recognition” is applied from fiscal year ended March 31, 2022.
For Investors
- Home
- /
- For Investors
- /
- Financial Information
- /
- Segment Information