学術論文確かな検証に裏打ちされた蕃爽麗茶
特定保健用食品として認可されるために、学術論文を提出し、効果効能について検証しています。
グァバ葉熱水抽出物のdb/dbマウスにおける抗糖尿病効果
およびヒト飲用試験による食後血糖値上昇抑制効果
グァバ葉ポリフェノールが、糖の吸収をおだやかにすることを検証しています

実験結果
1.試料の調製
グアバ葉熱水抽出物のin vitro における糖類分解酵素阻害について調べた。Fig.1に示したようにマルトース(A)、シュクロース(B)、可溶性デンプン(C)の分解はGvExの添加で抑制された。
GvExのマルターゼ、シュクラーゼ、αーアミラーゼに対する50%阻害濃度を求めたところ、マルターゼに対しては2.1mg/ml、シュクラーゼに対しては3.6mg/ml、αーアミラーゼに対しては0.6mg/mlであった。(Fig.2)。
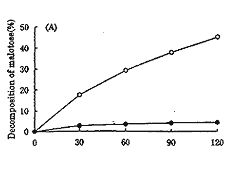
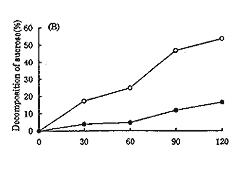
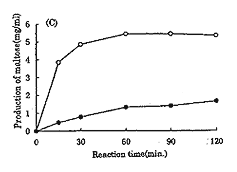
Fig.1
Inhibitory Effect of the GvEx on the Activity of Maltase (A), Sucrase(B), and α-Amylase(C).
Inhibitory effect of GvEx on three sugar degrading abilities were determined by measuring comparatively with(●)or without(○)GvEx added to the corresponding enzyme reaction mixtures.
Maltase and sucrase activities were examined by the hydrolysis of the substrates, maltose and sucrose, respectively, added in the reaction mixtures. The decomposition was defined as percent increase in glucose compared with the substrates were decomposed to 100%. α-Amylase activity was examined by increase of the concentration of maltose produced during degradation reaction of soluble starch
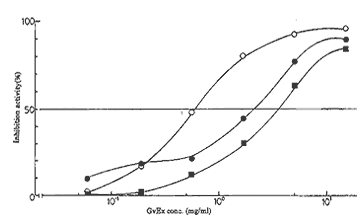
Fig.2
Dose Response Curves of Inhibitory Effect of GvEx on the Activities of Maltase, Sucrase, and α-Amylase.Inhibitory effect of GvEx on the activities of these enzymes was determined same as described in Fig.1. Inhibition percent was defined as compared with control reaction in which glucose or maltose produced was 100%.
Symbols:○,α-Amylase; ●,maltase; ■,sucrase.
2.正常マウスへの糖負荷試験
マルトース、シュクロース、可溶性デンプンのそれぞれを負荷した場合の血糖値の上昇に対するGvExの抑制作用について調べた。マルトース、シュクロース負荷試験ではICRマウスにGvEx500mg/kg(体重)、可溶性デンプン負荷試験には in vitro の試験で50%阻害濃度が低かったため、250mg/kg(体重)をそれぞれ投与した。GvEx液、あるいは生理食塩水投与30分後では血糖値は若干上昇するが、有意な差は認められなかった。マルトース、可溶性デンプン負荷試験ではGvEx投与群は対照群に比べて血糖値曲線下面積(AUC)がそれぞれ29.6%、37.8%、有意に減少した(p<0.05)。シュクロース負荷試験においてもAUCは31.0%減少した(p=0.06)(Fig.3)。
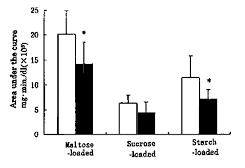
Fig.3
Effects of GvEx on Postprandial Blood Glucose Level in Maltose-, Sucrose-, or Soluble Starch Loaded Mice.
Mice were loaded maltose, sucrose or soluble starch at 30min after administration of GvEx. Values were obtained from the area under the blood glucose curve from 30 min to 120 min after sugar loading. Symbols:open bar, control mice without administrating of GvEx; closed bar, GvEx administrating mice. The straight line above the bar represents standard deviation and *represents p<0.05.
3.糖尿病自然発症モデルマウスへのGvEx経口投与
GvExはGvEx摂取量が250mg/kg(体重)/dayとなるように水に混ぜて7週間投与した。投与期間中の飲水量と摂餌量はGvEx群で低い傾向を示したが、有意な差は認められなかった(data not shown)。体重の変化をFig.4に示した。投与3週目まで対照群、GvEx群ともに体重は増加したが、投与5週目で体重増加が停止あるいは減少した個体数は対照群では10匹中6匹、GvEx群では9匹中3匹であった。
GvEx群と対照群では共に血糖値は著しく高く、随時血糖値(空腹時血糖ではない)に違いは見られなかった(TableI)。一方、投与期間中の平均血糖値を示すHbA1c%は投与5週目、7週目ともにGvEx投与群で有意な低下を示した。
インスリン濃度は対照群に比べGvEx群で高い傾向を示した。各個体の血漿インスリン濃度とHbA1c%をFig.5に示した。対照群ではインスリン濃度が低く、HbA1c%が高い個体が多いのに対して、GvEx群ではインスリン濃度が高く、HbA1c%が低い個体が多かった。
腎臓についてメサンギウム基質の肥厚した程度を-、±、+、++に分類し(Fig.6)、評価は+以上を示した糸球体数を数えて肥厚M数とした。その結果腎臓メサンギウム基質の肥厚を示す糸球体数はGvEx群で有意に減少した(TableII)。
膵臓についてはランゲルハンス氏島の数と大きさを測定した結果、ランゲルハンス氏島の数には違いがなかったが、面積はGvEx群で大きい傾向を示した(TableII)。
投与期間中、対照群、GvEx群ともに死亡例はなく、下痢、盲腸の肥大は認められなかった。
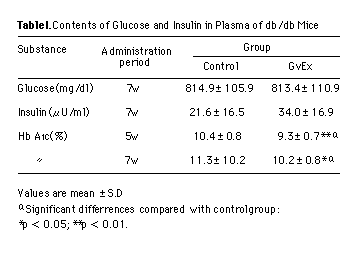
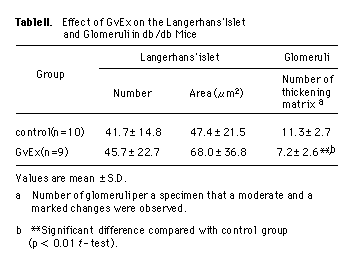
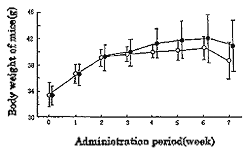
Fig.4
Body Weight of Animals.
Each symbols are mean±S.D. Symbols:○,control mice without GvEx-fed; ●,GvEx-fed mice.
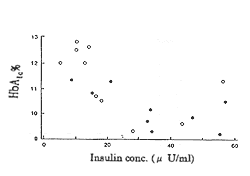
Fig.5
The Relationship between % of HbA1c and Concentration of Insulin in Plasma of Each Animal.
Symbols:○,mice without GvEx-fed; ●,GvEx-fed mice.
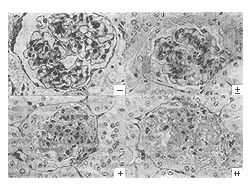
Fig.6
Photomicrographs of Glomeruli in db/db Mice with or without GvEx-fed.
Grade of thickening of the glomerular
mesangial matrix is shown. -, normal; ±,weak; +,moderate; ++,heavy.
4.グアバ茶のヒト飲用試験
対象者の特性をTableIIIに示した。19名の対象者が食事とともにグアバ茶を飲用した場合、白湯を飲用した場合に比べて30、90、120分の血糖値は有意に低下し、血糖値曲線下面積(AUC:min・mg/dl)は対照飲用期21613±5424に対してグアバ茶飲用期は20157±4564と有意な低下を示した。対象者19名中8名の空腹時血糖値(FBG)は100mg/dlであった。この8名における対照飲用期のAUCは19191±1571(min・mg/dl)であったのに対し、グアバ茶飲用期のAUCは1803±1553(min・mg/dl)で有意な上昇抑制は認められなかった。一方、FBG 100mg/dl以上の11名において血糖値は30、120分で有意に低下し、白湯飲用期のAUCは23541±5982(min・mg/dl)に対して、グアバ茶飲用期のAUCは21827±5355(min・mg/dl)で有意な低下であった(Fig.7)。
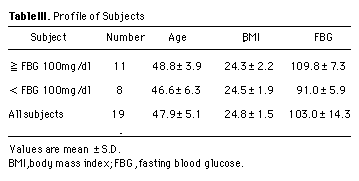
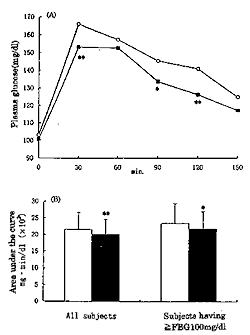
Fig.7
Effect of Guava Tea on the Postprandial Glucose in Human Subjects.
After being fasted for 11h, subjects took the test meal either with hot water or guava tea. Blood glucose was measured at variously different time points after the ingestion.
Significant difference from control was calculated by the Paired t-test(**p<0.01; *p<0.05).
(A)Time course in changes of blood glucose level with total subjects.
Symbols:○, control with hot water; ●,guava tea administrated.
(B)Area under the curves with all subjects and subjects having ≧FBG 100mg/dl.
Symbols:open bar, control with hot water; closed bar, guava ter administrated; straight line above each bar, standard deviation.
